SOP4CWD: CWD Surveillance Web Applications
The Surveillance Optimization Project for Chronic Wasting Disease (SOP4CWD) is a collaborative international effort to develop quantitative tools and software to aid state and provincial wildlife agencies responding to CWD. The project is led jointly by the Cornell Wildlife Health Lab at Cornell University and the Boone and Crockett Quantitative Wildlife Center at Michigan State University.
The SOP4CWD modeling team has produced custom web-based software applications to provide participating state and provincial wildlife agencies access to quantitative tools and information useful for CWD surveillance and response.
The software applications are available to limited agency staff by state or province through the secure links at the bottom of this page. A user account is required for access.
Summarized Test Results
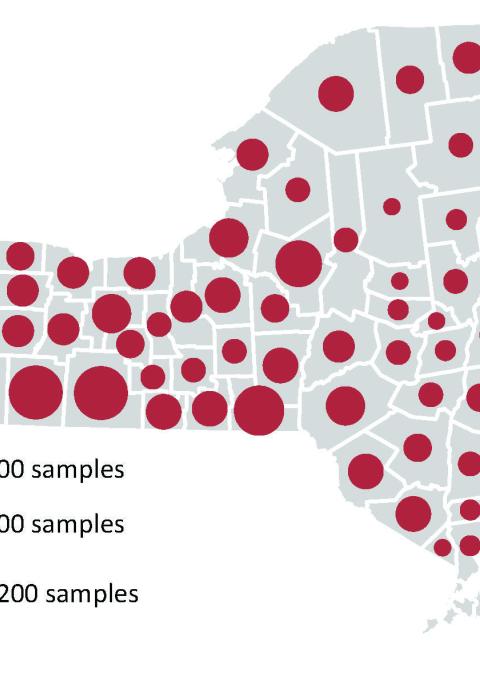
The Positives Software includes summaries of CWD testing data from white-tailed deer by county, including the number of positive samples, testing efforts, and CWD prevalence by age/sex segment. The state/province-level app shows the data from the given jurisdiction plus the data from contiguous states and provinces. The regional app shows all the data from states and provinces participating in the SOP4CWD project.
Tutorial for Shiny App on SOP4CWD Positives
Disease Hazard Identification
The Hazard Software combines results from the Introduction Hazard and Susceptible-Exposed-Infected (SEI) models to identify areas more likely to face novel outbreaks of CWD that could spread rapidly. The state/province-level app shows the data from the given jurisdiction plus the data from contiguous jurisdictions. The regional app shows data from states and provinces participating in the SOP4CWD project.
Shiny app tutorial on the SOP4CWD Hazard tool
Areas of Increased Concern for Disease Spread
The SEI and SLEI software provides standardized tools to compute the R0 value for every county and province in the US and Canada, so that wildlife managers may pinpoint areas that contain the potential for a quickly-spreading outbreak. The peer reviewed work guides state and provincial wildlife managers in the allocation of limited disease surveillance resources, whenever disease is unevenly distributed across a vast jurisdiction.
High-Risk Locations
The Habitat Risk Software includes maps showing habitat characteristics that play a role in CWD persistence and spread. The software is available only for areas in which surveillance data provide specific sampling locations, such as latitude/longitude.
Shiny app tutorial for SOP4CWD Habitat Risk
Optimal Sampling Design
The Optimization Software leverages a combinatorial optimization algorithm to allocate financial resources in areas with novel outbreaks that are likely to persist and areas with established CWD infections. For demonstration purposes for states/provinces in which additional data is necessary for model execution, mock data have been generated and used in the software application. These software applications have been provided to illustrate the function of the model and software.
Shiny app tutorial for SOP4CWD Optimization tool
Beta Testing of the Interactive Software
Development of the interactive software for ultimate use by agency professionals required significant interdisciplinary cooperation. We thank our beta testers who volunteered their time to examine the prototype versions of our apps and provide thoughtful feedback and suggestions for improvement. The SOP4CWD collaboration thanks:
- Andrea Korman
- Cara Them
- Corey Mitchell
- Erick Gagne
- James Kelly
- Jeannine Fleegle
- Jennifer Peaslee
- Lauren Miller
- Nick Hollingshead
- Rachel Abbott
- Russ Mason
- One additional anonymous beta tester
Future Feedback
The SOP4CWD collaboration welcomes additional feedback and suggestions for improvement! Please send your feedback to SOP4CWD@cornell.edu.