Visualizing how the growth rates respond to alterations in life history traits
Population matrix models are important mathematical tools in ecology (Morris & Doak, 2002). At their core, population matrix models decompose life histories into a single mathematical expression. This mathematical expression - the matrix L - provides machinery to calculate the growth rate (λ) of the population (Caswell, 2001):
Lw=λw
Despite this elegant equation, understanding the nature of the growth rate ("dominant eigenvalue") and how it relates to the life history is tricky.

What does this equation tell us about a wildlife population?
The matrix L can be rewritten into a balance equation ("characteristic equation"). We use this characteristic equation to demonstrate that the growth rate is merely an isostatic mechanism; it balances the positive and negative contributions from each life history characteristic into an overall summary of population performance.
This software produces an interactive visualization of the positive and negative contributions that arise from each life history characteristic, and demonstrates how peculiar combinations of characteristics cause the growth rate to soar or plummet.
What does this equation tell us about a management strategy?
In addition to providing a measure of population viability, matrix models are frequently used to identify management activities that may be used to attain desired population goals. Managers deliberately alter a life history characteristic ("vital rates") to achieve a desired growth rate. For example, noxious weed biologists regularly spray rosettes with the desire to halt reproduction, while endangered species biologists regularly enhance survival to increase growth rates. But do these targeted activities equate to clean cause and effect?
No.
The balance equation shows that for every action, there is an equal reaction.
This interactive app allows users to:
1) Visualize how life history characteristics aggregate into p and q and r superparameters, and then how those superparameters aggregate into the population growth rate.
2) Visualize the contribution of each life history trait to the characteristic equation, λ^3 + pλ^2 + qλ +r = 0.
3) Understand how targeted managerial alteration of one (or more) life history traits will change the growth rate.
4) Understand how targeted managerial alteration of one (or more) life history traits will change the contributions of other life history traits to the growth rate.
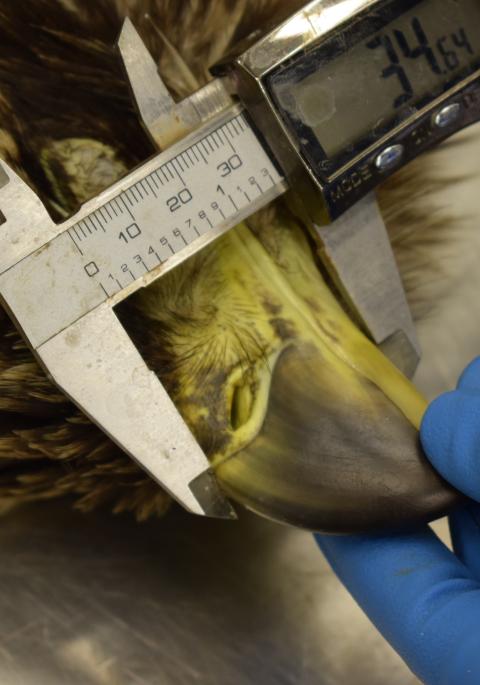
Five hundred and eleven unique 3-stage population matrix models exist. The dynamics in this app are applicable to all 511, not the least being applicable to the majestic Bald Eagle.
Questions regarding the software?
Contact Brenda Hanley (bjh262@cornell.edu)
The population matrix model
The population matrix model is a stage-structured demographic model that links vital rates in a life history to the population-scale dynamics that they generate (Tuljapurkar, 2008). Also known as the Leslie matrix (age structured; Leslie, 1945) or Lefkovitch (stage structured; Lefkovitch, 1965), the population matrix model has been used to enhance understanding of population viability of nearly 8,000 floral and faunal systems across the globe (see Salguero-Gomez et al., 2014, Salguero-Gomez et al., 2016). The dominant eigenvalue of the model matrix is the single most important measure of population viability.
The population matrix model has also been used in sensitivity analysis; that is, to understand the differential effects that targeted modifications to individual vital rates have on overall population dynamics (de Kroon et al., 2000). The capacity to reveal sensitivities between vital rates and growth rates makes the population matrix model a handy tool in identifying, exploring, and guiding the adoption of management alternatives in the pursuit of some management goal.
Taken together, these population viability and sensitivity analysis capabilities have made population matrix models the premier tool of population modeling.

Instructions for use:
Step 1: Input all nine vital rate magnitudes. Vital rates must be positive real numbers. Zero is a valid input for any given vital rate magnitude.
Step 2: Save your entries.
Step 3: Navigate to the remaining tabs.
For each set of vital rate inputs, the code will produce a visualization of an eigenvalue cube, the visualization of the p volume, a visualization of the breakdown of the q volume and the visualization of the breakdown of the r volume.

The software assumes a one-sex deterministic model matrix for an iteroparous species
These equations help us understand process at the expense of ecological detail, and therefore hinge on several simplifying assumptions. The equations do not account for:
1) Carrying capacity,
2) Differential in life history traits that arise from genetic sources,
3) Differential in life history traits due to the sex ratio,
4) Behaviour of the individuals over time,
5) Any type of variation (demographic, environmental, sampling),
6) Weather, climate, or seasonality,
7) Competition with other species,
8) Migration,
9) Predation.
Although cause and effect may be altered by these real world ecological considerations, a tool to aid in understanding the deterministic processes are educational.
- Do there appear to be any vital rates that have a stronger influence on the growth rate than others?
- When you alter a life history characteristic, which superparameter does it change? (p, q, or r, or some combination of them?)
- Calculated volumes hinge on situational combination of vital rates. In the context of your system, what can be done if you wish to grow a population? Shrink a population?
- Are there any vital rates that functionally do not contribute to the growth rate?
- Are there alterations that result in zero change to the growth rate?
- Say you are a manager and you increase adult survival (alter a33). Will a13 get more or less influential to the growth rate after the alteration?

This software is described in:
Hanley B, Connelly P, & Dennis B. 2019. Another look at the eigenvalues of a population matrix model. PeerJ 7:e8018. https://doi.org/10.7717/peerj.8018
Preferred citation for the use of this software:
Hanley B, Connelly P, & Dennis B. 2019. IsoPOPd: Interactive software to understand how elements in a population matrix model influence the asymptotic population growth rate [Software]. Cornell University Library eCommons Repository. doi: https://doi.org/10.7298/bcmg-7w08
The growth rate is calculated using long-established equations of population matrix models (Caswell, 2001). Our contribution was to create these geometric illustrations of the balance equation, and make it accessible through an interactive app.
Mathematical references
Caswell, H, (2001). Matrix population models: construction, analysis, and interpretation, 2 ed. Sinauer Associates, Inc, Sunderland, Massachusetts, USA.
de Kroon, H, van Groenendael, J, Ehrlén, J (2000). Elasticities: A review of methods and model limitations. Ecology, 81, 607–618.
Hanley, BJ, & Dennis, BC (2019). Analytical expressions for the eigenvalues, demographic quantities, and extinction criteria arising from a three-stage wildlife population matrix. Natural Resource Modelling.
Lefkovitch, LP (1965). The study of population growth in organism groups by stages. Biometrics, 21, 1-18.
Leslie, PH (1945). On the use of matrices in certain population mathematics. Biometrika, 33, 183-212.
Tuljapurkar, S (2008). Stable population theory. The New Palgrave Dictionary of Economics. 2nd Edition. (eds). Steven N. Durlauf and Lawrence E. Blume. Palgrave Macmillan, United Kingdom.
Software references
R Core Team (2018). R: A language and environment for statistical computing. R Foundation for Statistical Computing, Vienna, Austria.
R Shiny (2018). Shiny. Web Application Framework for R.
RStudio Team (2015). RStudio: Integrated Development for R. RStudio, Inc., Boston, MA
We’d also like to thank the R online user community (eg. several anonymous coders, Matthew Plourde) for providing example code and insight on programming around various obstacles (e.g. https://stackoverflow.com/questions/25455154/navlistpanel-make-tabs-sequ...).