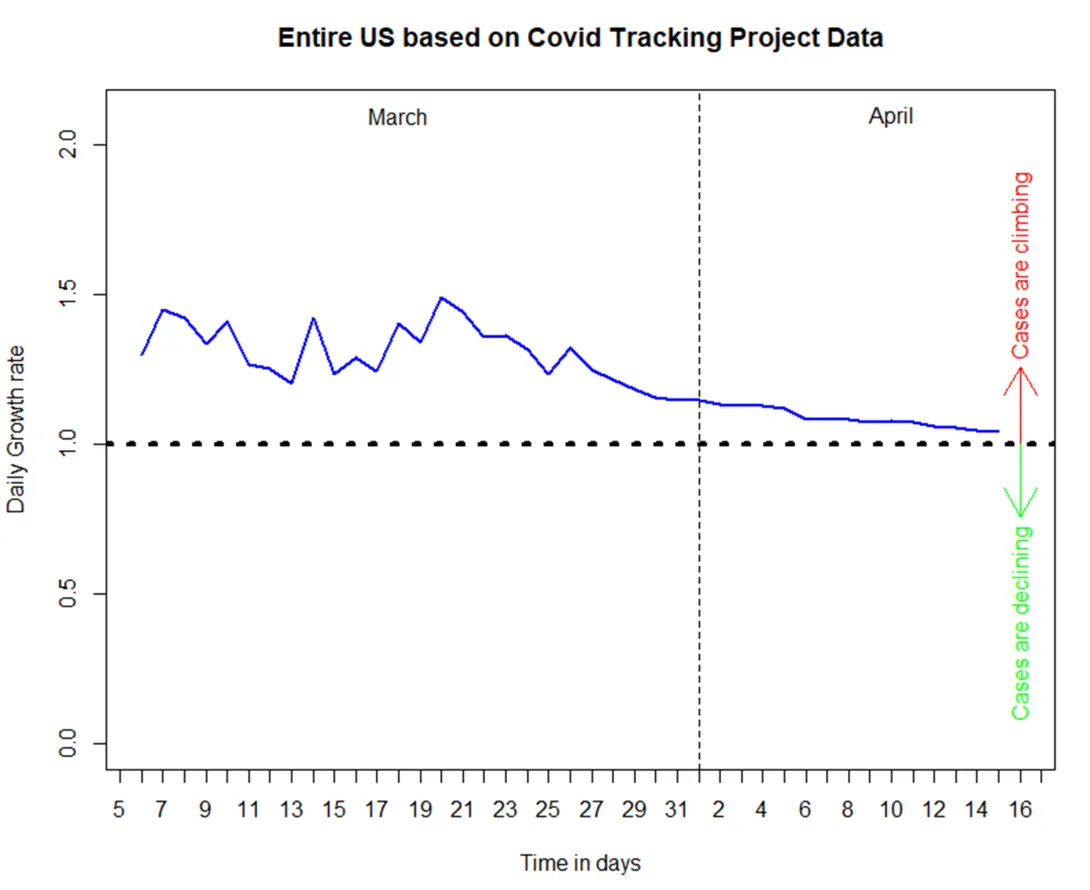
The figure above shows the time series of one-day growth rates calculated from publicly available case count data in the US.
Image
The figure above shows the time series of one-day growth rates calculated from publicly available case count data in the US. Data taken for the entire US from The COVID Tracking Project 4 March 2020 – 15 April 2020.