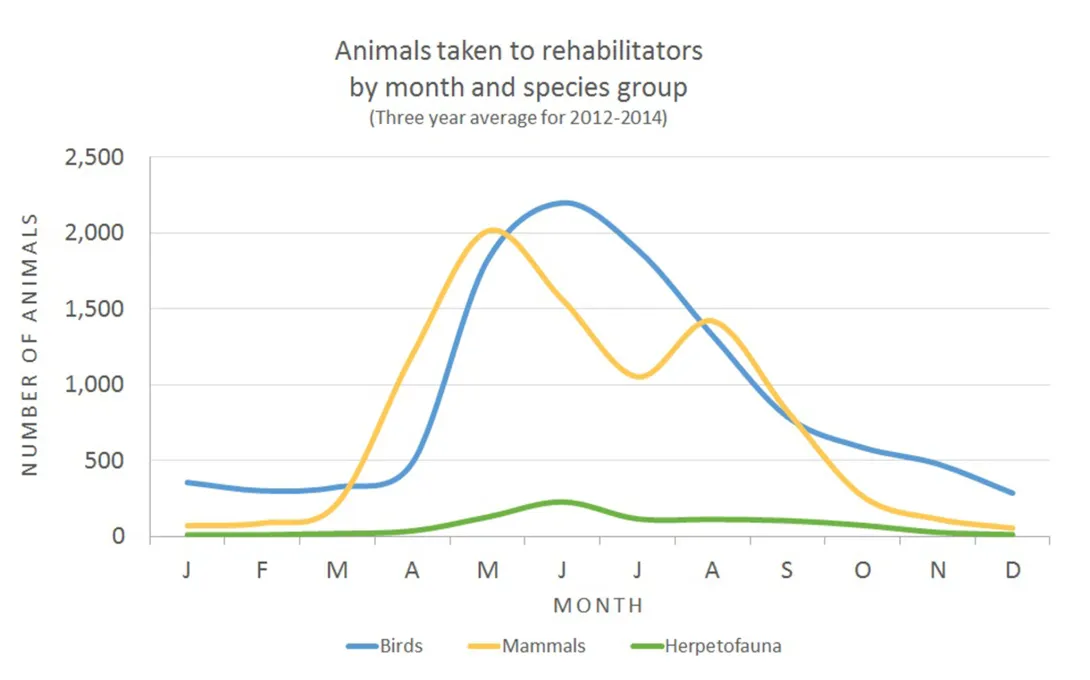
This graph shows average numbers of birds, mammals, and herpetofauna (reptiles and amphibians) brought to wildlife rehabilitators each month for the years 2012 through 2014.
This graph shows average numbers of birds, mammals, and herpetofauna (reptiles and amphibians) brought to wildlife rehabilitators each month for the years 2012 through 2014.
Image
This graph shows average numbers of birds, mammals, and herpetofauna (reptiles and amphibians) brought to wildlife rehabilitators each month for the years 2012 through 2014.